Spectroscopy Module (sbpy.spectroscopy)
Introduction
spectroscopy provides routines for working with emission and reflected/scattered light from asteroids and comets.
Spectral Gradients
Spectral gradient or slope is a measurement of the shape of a spectrum. It is commonly expressed as a percent change per wavelength interval, e.g., % per 100 nm or % per 0.1 μm. Equation 1 of A’Hearn et al. (1984):
where R(λ) is the reflectivity at wavelength λ.
The class SpectralGradient enables easy
conversion between spectral gradient and color index (magnitudes), and
re-normalization to other wavelengths.
SpectralGradient is a Quantity with units of
inverse length. For convenience, sbpy includes a
hundred_nm unit, which is equal to 100 nm:
>>> import astropy.units as u
>>> from sbpy.spectroscopy import SpectralGradient
>>> from sbpy.units import hundred_nm
>>> import astropy.units as u
>>> from sbpy.spectroscopy import SpectralGradient
>>> from sbpy.units import hundred_nm
>>> S = SpectralGradient(10 * u.percent / hundred_nm)
>>> print(S)
10.0 % / (100 nm)
Initialize a spectral gradient from a color index:
>>> w = (550, 650) * u.nm
>>> SpectralGradient.from_color(w, 0.1 * u.mag)
<SpectralGradient 9.20383492 % / (100 nm)>
Note we use the dimensionless magnitude unit from astropy, i.e., not
one that carries flux density units such as astropy.units.ABmag.
Convert spectral gradient (normalized to 550 nm) to a color index:
>>> S = SpectralGradient(10 * u.percent / hundred_nm, wave0=550 * u.nm)
>>> S.to_color((500, 600) * u.nm)
<Quantity 0.10866423 mag>
Renormalize to 1.0 μm:
>>> S = SpectralGradient(10 * u.percent / hundred_nm, wave0=550 * u.nm)
>>> S.renormalize(1 * u.um)
<SpectralGradient 6.89655172 % / (100 nm)>
Spectral Reddening
Linear spectral reddening is enabled by the class Reddening,
which is based on BaseUnitlessSpectrum.
Initialize a Reddening class from a spectral gradient:
import matplotlib.pyplot as plt
import astropy.units as u
from sbpy.spectroscopy import SpectralGradient, Reddening
from sbpy.units import hundred_nm

S = SpectralGradient(10 * u.percent / hundred_nm, wave0=0.55 * u.um)
linear_reddening = Reddening(S)
linear_reddening.plot()
plt.gca().grid()
(Source code, png, hires.png, pdf)

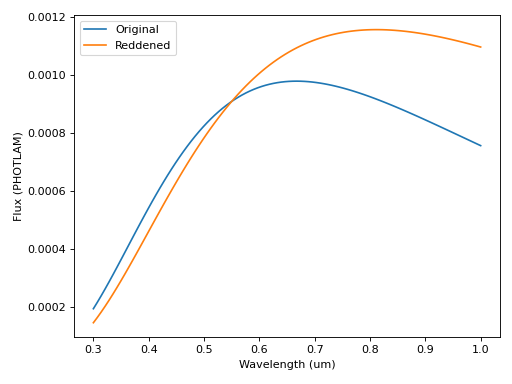
This class can then be used to linearly redden a spectrum as a
SourceSpectrum class instance:
import numpy as np
import matplotlib.pyplot as plt
import astropy.units as u
from synphot import SourceSpectrum
from synphot.models import BlackBodyNorm1D
from sbpy.spectroscopy import SpectralGradient, Reddening
from sbpy.units import hundred_nm

S = SpectralGradient(10 * u.percent / hundred_nm, wave0=0.55 * u.um)
linear_reddening = Reddening(S)
spec = SourceSpectrum(BlackBodyNorm1D, temperature=5500 * u.K)
reddened = spec * linear_reddening
wv = np.linspace(0.3, 1, 100) * u.um

plt.plot(wv, spec(wv))
plt.plot(wv, reddened(wv))
plt.legend(['Original', 'Reddened'])
plt.setp(plt.gca(), xlabel='Wavelength (um)', ylabel='Flux (PHOTLAM)')
plt.tight_layout()
(Source code, png, hires.png, pdf)

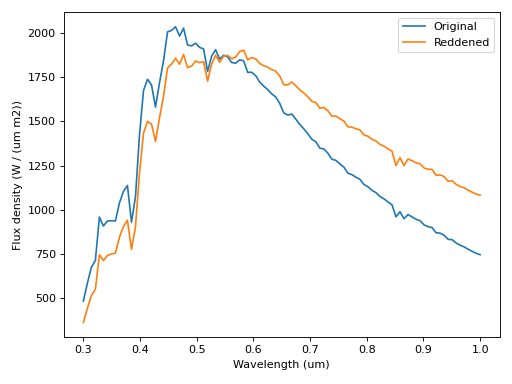
sbpy SpectralSource objects have a redden() method for reddening.
The following example reddens a solar spectrum:
import numpy as np
import matplotlib.pyplot as plt
import astropy.units as u
from sbpy.calib import Sun
from sbpy.spectroscopy import SpectralGradient
from sbpy.units import hundred_nm

sun = Sun.from_builtin('E490_2014LR') # low-resolution solar spectrum
S = SpectralGradient(10 * u.percent / hundred_nm, wave0=0.55 * u.um)
red_sun = sun.redden(S)

wv = np.linspace(0.3, 1, 100) * u.um
fluxd_unit = u.Unit('W/(m2 um)')

plt.plot(wv, sun.observe(wv, unit=fluxd_unit))
plt.plot(wv, red_sun.observe(wv, unit=fluxd_unit))
plt.legend(['Original', 'Reddened'])
plt.setp(plt.gca(), xlabel='Wavelength (um)',
    ylabel='Flux density ({})'.format(fluxd_unit))
plt.tight_layout()
(Source code, png, hires.png, pdf)

Reference/API
sbpy module for small body spectroscopy
Classes
|
Blackbody sphere. |
|
Class to handle simple linear reddening. |
|
Convert between magnitude and spectral gradient. |
Range of spectral models |
|
|